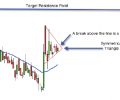
The Symmetrical Triangle pattern is identified by drawing two trendlines that connect a series of sequentially lower peaks and a series of sequentially higher troughs. Both trendlines act as barriers that prevent the price from heading higher or lower, but once the price breaches one of these levels, a sharp movement often follows. This is why we want to wait for the price of the stock to break out over the upper line before we buy it.
