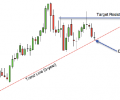
This is a weekly candle chart for Pfizer, Inc. (PFE) and as you can see the stock has been holding its long-term trend line like a charm. This week the price has formed a Doji. The Doji usually shows up a key reversal points and represents a sign of indecision. The sellers are losing their momentum right at a key support level (trendline) and there is a good chance the stock will rally from this point.
